Real-Time Particulate Monitoring in Water for Injection
In-line dynamic imaging of sterile water processing automates laboratory quality control tasks
Reliable control of particles in WFI is no longer just a compliance checkbox—it’s a lever for reducing batch risk, shortening investigations, and protecting sterile manufacturing capacity. By combining Water for Injection particulate monitoring with dynamic imaging particle analyzer technology from JM Canty, and local integration support from Clipper Controls, facilities can move from intermittent lab tests to true real-time insight into what is happening inside their WFI systems.
👉 If you’re relying solely on grab samples to manage particles in WFI, it may be time to rethink your strategy. Contact Clipper Controls to explore real-time Water for Injection particulate monitoring options.
Explore Similar Pages: JM Canty: Inline Process Imaging and Real-Time Analysis | Flow Instrumentation Products for Liquid & Gas |
Why Particles in WFI Are a Hidden Business Risk
The cost of foreign particulate in sterile water
- Costly batch holds or outright scrapping
- Time-consuming investigations across production, utilities, and quality
- Delays in sterile injectable manufacturing schedules
- Potential product shortages and reputational damage
- Detect foreign particulate in WFI before it reaches critical end users
- Correlate spikes to specific processes (filter changes, maintenance, system upsets)
- Prevent nonconforming WFI from being used in production steps
Regulatory expectations: more than just “pass the test”
- Intermittent visibility – You only see what happened at the moment of the grab sample, not what happened in the hours or days between.
- Sampling bias – Low, sporadic contamination may be missed entirely if the event doesn’t coincide with a sample.
- Limited diagnostic value – A failing USP 788 result tells you there’s a problem. It does not tell you where in the WFI system the particles originated or when they appeared.
- Build a stronger, data-backed story around control of particulates
- Respond faster when excursions occur
- Support investigations and CAPAs with time-stamped, process-linked evidence

Why particles in WFI threaten more than just compliance
- Upstream equipment wear – Metallic or oxide particles may point to rouge development, pump wear, or valve damage.
- Biofilm or cleaning issues – Organic or irregular-shaped particles can hint at biofilm shedding or incomplete cleaning, long before traditional microbiological tests show a clear deviation.
- Filtration and distillation performance shifts – Changes in particle size distribution at the outlet of reverse osmosis, vapor compression distillation, or multiple effect distillation units can indicate fouling or breakthrough.
- Protect downstream sterile injectable manufacturing process monitoring efforts
- Optimize cleaning and maintenance cycles
- Support capital planning with real data instead of periodic snapshots
👉 Interested in seeing what’s really in your Water for Injection, not just a particle count? Call (844) 880-2469 or message us to learn more about how we can help.
Why Traditional USP 788 Methods Aren’t Enough for WFI Systems
Limitations of light obscuration particle count tests
- It cannot tell the difference between gas bubbles and real particles, so air entrainment or microbubbles can be miscounted.
- It provides no shape information, which makes it hard to distinguish droplets, fibers, or irregular contaminants.
- It is sensitive to changes in clarity, refractive index, and sample handling.
Pain points of manual microscopic particle counts
- Labor intensive: A trained analyst must visually scan slides or filters for long periods.
- Low throughput: Only a limited number of samples can be processed per shift, which discourages frequent monitoring.
- Sampling and handling risk: Transferring WFI into vials, shipping to the lab, and preparing slides all create opportunities for contamination or particle loss.
- Inconsistent results: Different analysts may interpret borderline features differently, especially at smaller sizes.
Why grab samples can mislead operators
- Pump starts and stops
- Valve operations or changeovers
- Temperature cycles and thermal shocks
- Upstream filtration, WFI distillation and reverse osmosis filtration monitoring issues
How Dynamic Imaging Transforms Water for Injection Particulate Monitoring
Dynamic imaging vs. light obscuration: what changes for WFI
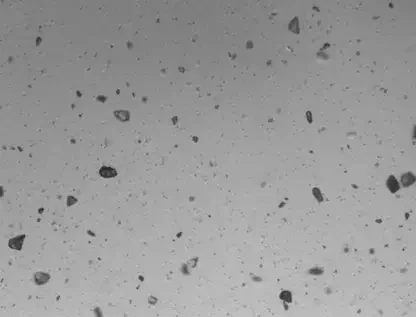
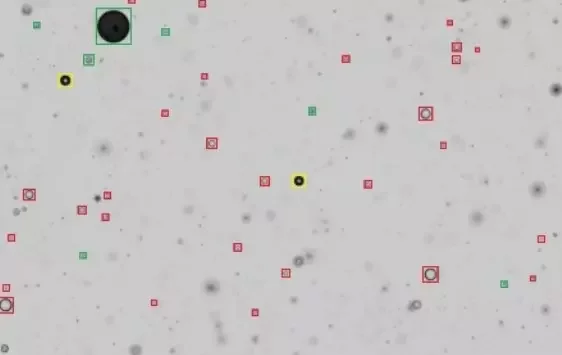
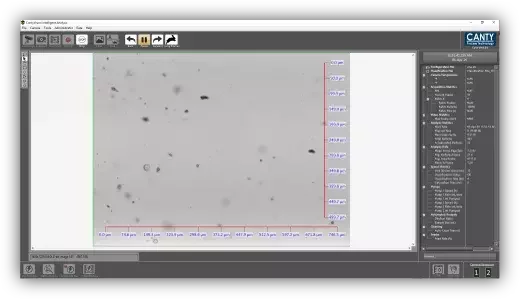
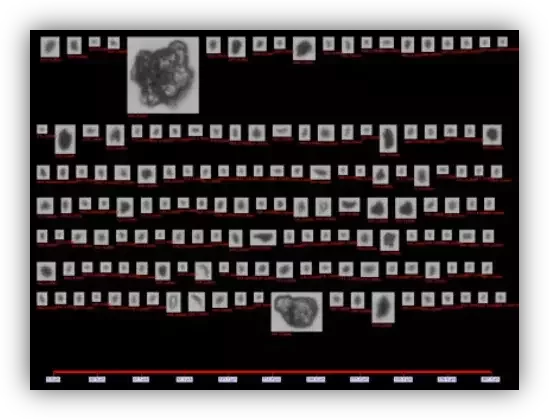
- See what light obscuration can only guess at – actual images of particles in flowing WFI instead of anonymous counts.
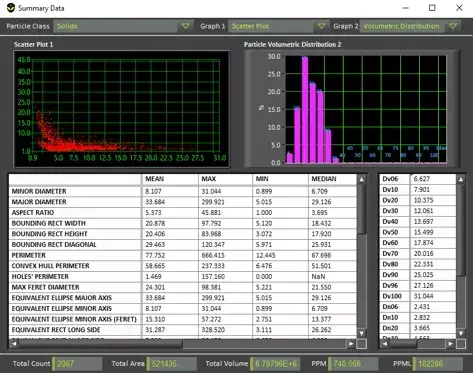
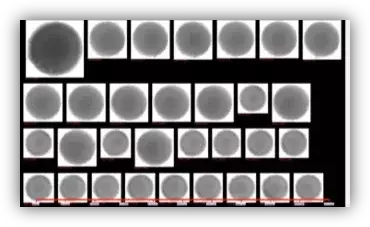
- Measure particle size distribution in WFI down to ~1 micron (configuration dependent), using calibrated pixel measurements rather than indirect extinction.
- Use shape and morphology to classify particles (aspect ratio, roundness, texture), something light obscuration cannot provide.
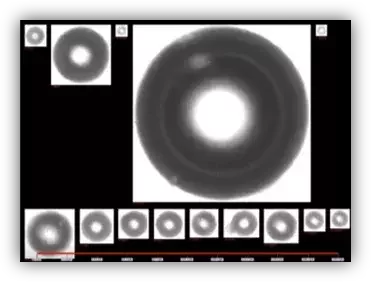
- Eliminate ambiguity between particles, droplets, and bubbles, where light obscuration often miscounts entrained gas as “particles.”

Understanding pixel scale factor and depth of field
- Pixel scale factor (PSF): The relationship between pixels in the camera sensor and real-world dimensions in the flow path. A well-calibrated PSF ensures each pixel corresponds to a known micron size, enabling accurate particle sizing across the field of view.
- Depth of field (DOF): The range in the direction of flow where particles remain in sharp focus. A controlled DOF ensures that particles are neither over- nor under-sized due to being out of focus.
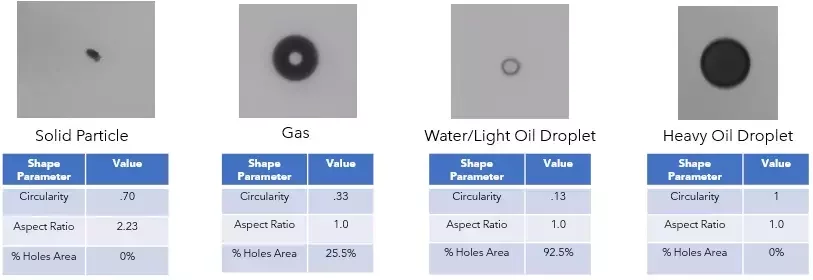
Discriminating solids, droplets, rouge, biofilm and bubbles
- Discrimination of gas bubbles in particle analysis, reducing false positives
- Identification of irregular, organic-like particles that can be indicative of biofilm
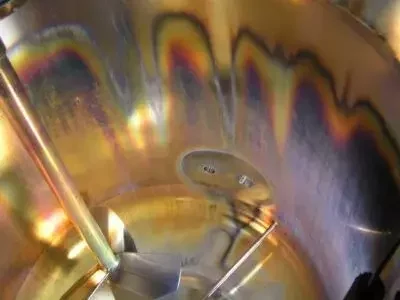
- Characterization of angular or reflective particles that may represent rouge or corrosion products
- Differentiation between spherical droplets and solid particulates
| Method / Attribute | Light Obscuration | Microscope | CANTY InFlow Dynamic Imaging |
|---|---|---|---|
| Rouge clarity | No – only sees attenuation, not color/shape | Yes* – analyst can visually identify rouge particles | Yes – 2D images and shape factors clearly show rouge vs other solids |
| Bubbles | Error – gas bubbles counted as particles | Can be visually recognized and ignored by analyst | Measure – bubbles are detected and classified separately from solids |
| High viscosity fluids | Limited – performance degrades with increased viscosity | Possible but sample prep/handling is slower* | Good within design flow range* – image-based, not beam-attenuation based |
| Sampling required | Yes – off-line grab sample needed | Yes – off-line sample & slide/filter prep | No – installed inline or at-line; no grab sampling required |
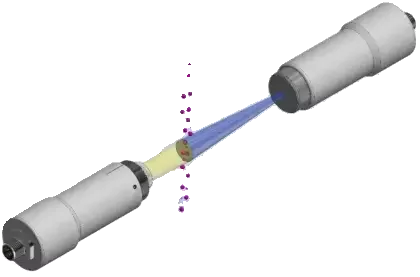
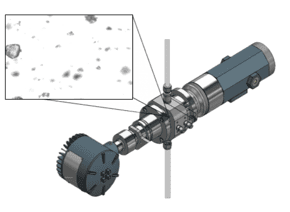
| Measurement principle | Laser light obscuration / extinction | Manual microscopic particle count | Inline dynamic imaging (camera + fused-glass flow cell + image analysis) |
| Real-time / inline monitoring | Typically off-line batch test* | No – off-line only | Yes – continuous inline or at-line monitoring of WFI stream |
| Representative of full WFI stream | Depends on grab sample; risk of non-representative data | Depends on grab sample; high risk of sampling bias | Yes – measures particles as they flow by in real time, no sample vial needed |
| Gas vs liquid vs solid discrimination | None – all counts look the same | Analyst can infer types visually* | Yes – software classifies solids, rouge, droplets, biofilm, and gas separately |
| Particle size information | Size bands only; no shape data | Approximate size vs graticule / reference* | Full particle size distribution, including counts/mL in USP 788/1788 bands |
| Image record / traceability | No images | Yes, but only if analyst manually captures images* | Yes – live and recorded images stored via CantyVision software |
| Labor requirement | Moderate – automated instrument but needs sampling, setup, cleaning* | High – manual counting, low throughput | Low – once installed and configured, analysis and reporting are automatic |
| Integration to control system | Limited – usually lab instrument, not tightly integrated* | None – manual entry into systems | Native integration via VCM: OPC UA, Modbus TCP/IP, Modbus RTU, 4–20 mA outputs |
| Best suited role | Final product / QC release testing | Investigative or confirmatory lab work | Inline WFI monitoring, filtration/distillation performance, rouge/biofilm trending |
* Entries marked with an asterisk indicate typical performance or workflow for WFI particle measurement and may differ for specific instruments, methods, or site practices.
Inline and At-Line Architectures for WFI Distribution and Production
Inline particle detection in sterile water at tank outlets and loops
- WFI process tank outlet monitoring
- Hot or cold WFI distribution loop monitoring
- Return lines where rouge, biofilm, or particulate load may shift over time
Monitoring WFI distillation and reverse osmosis filtration performance
- Reverse osmosis WFI systems in pharma plants – Detect membrane fouling or breakthrough by tracking changes in particle size and counts.
- Vapor compression distillation WFI quality control – Confirm that the distillation process is consistently removing particulates.
- Multiple effect distillation WFI purity monitoring – Spot shifts that may indicate scaling, corrosion, or other process concerns.
At-line, portable and lab-based options
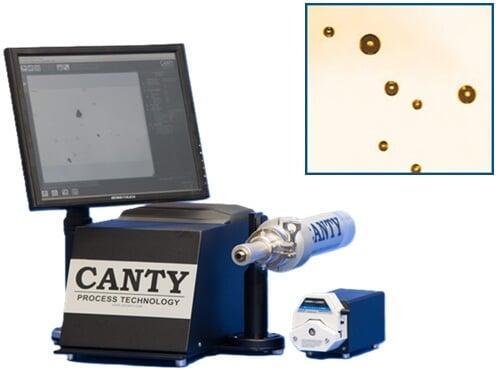
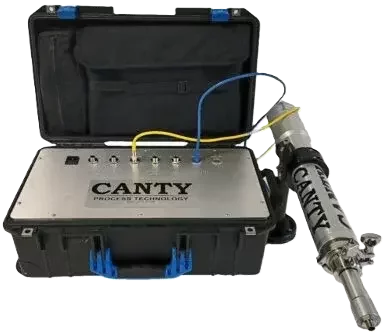
- CANTY Mini Lab InFlow laboratory particle analyzer – Ideal for QC labs, pilot plants, and R&D work where WFI and process fluids can be evaluated under controlled conditions with microscopic imaging for process fluids.
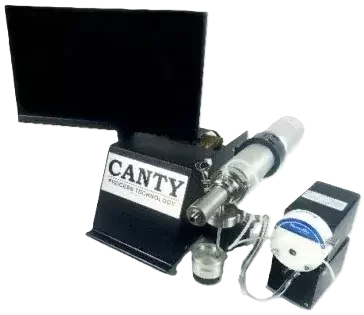
- CANTY Portable InFlow temporary WFI monitoring – A skid-mounted or portable system that can be deployed for projects, validations, or troubleshooting campaigns to get real-time particle data from specific tie-in points without a permanent installation.
👉 Want your WFI particle data where your operators already work? Ask Clipper Controls how to connect CANTY InFlow analyzers through the Vector Control Module into your existing control and historian platforms.
From Particles in WFI to Process Decisions: Using Real-Time Data
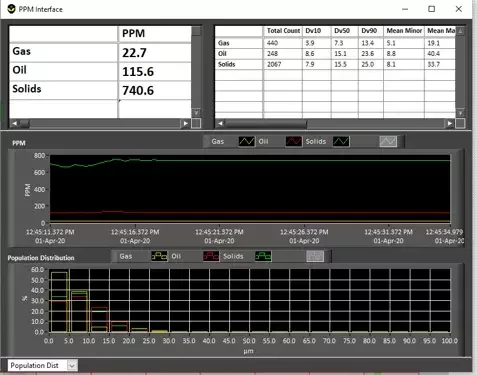
Real-time WFI contamination monitoring and alarms
- Counts per mL by size range
- Particle size distribution trends over time
- Shifts in particle type (e.g., more metallic vs. organic)
- Automatically block WFI supply to critical users when counts exceed setpoints
- Trigger maintenance inspections or cleaning cycles based on actual data
- Document how quickly the system returns to baseline after interventions
Optimizing WFI filtration and distillation using particle count data
- Filter performance: Detect progressive fouling or breakthrough by spotting slow rises in particle counts downstream of filters.
- Distillation health: Use particle count data to correlate WFI quality changes with feed quality, operating conditions, or maintenance events.
- Troubleshooting: When you see unexpected excursions, troubleshooting WFI contamination with dynamic imaging analyzers becomes much easier because you can correlate events with operational data in real time.
De-rouging, cleaning validation, and biofilm monitoring
- “How do we know if our de-rouging was effective?”
- “Is our cleaning frequency appropriate for this WFI loop?”
- “Are we seeing early signs of biofilm?”
- Real-time monitoring of rouge and biofilm in WFI systems
- Data-driven de-rouging and cleaning validation in WFI lines
- Before/after comparisons for chemical cleaning campaigns
- Verification that cleaning has actually stabilized particulate levels
CFU, bioburden, and image-based insight for WFI
- Use real-time particle trends to focus where and when you pull microbiological samples
- Interpret unexpected CFU excursions in the context of what was happening in the WFI loop at the time
- Treat image-based measurements as an early warning tool for bioburden and biofilm, while CFU plate counts remain your formal release test
Connectivity, Data Integration, and Compliance Documentation
CANTY Vector Control Module (VCM) connectivity
- OPC UA for modern DCS and SCADA platforms
- Modbus TCP/IP or Modbus RTU for legacy systems
- 4–20 mA outputs for simple thresholds or trending
- Digital alarms for high particle load events
Integrating WFI particle data into plant historians and MES
- Plant historians for long-term storage and trending
- MES and batch records for contextualizing particulate events in production runs
- Data analytics platforms for advanced visualization and correlation
Supporting audit trails and data integrity
- Faster investigations and CAPAs when particulate issues arise
- Clear documentation of system control for inspections
- Demonstrable evidence that inline particle detection in sterile water is part of your quality strategy, not just a “nice to have”
Choosing the Right CANTY InFlow Configuration for Your WFI System
New WFI system design and greenfield projects
- Inline analyzers at key stages of reverse osmosis WFI systems in pharma plants
- Monitoring at the discharge of vapor compression distillation or multiple effect distillation units
- WFI process tank outlet monitoring to protect the distribution loop and end users
Retrofitting existing purified water and WFI systems
- Suitable tie-in locations for inline fused-glass flow cells
- Where inline particle detection in sterile water is practical vs. where at-line or portable setups make more sense
- How to stage investments, starting with high-risk locations and expanding coverage over time
Lab, validation, and troubleshooting scenarios
- Qualification and optimization of new filtration or WFI generation steps
- Detailed examination of particles in WFI retrieved from specific parts of the system
- Validation studies comparing dynamic imaging results to traditional methods
Business Case: Why Dynamic Imaging Delivers More Value Than Light Obscuration for WFI
Reducing batch risk and investigation time
- Lower risk of surprise particulate findings in finished product
- Shorter, more focused investigations, using time-stamped WFI data
- Stronger linkage between Water for Injection particulate monitoring and process events
Lowering manual sampling and lab workload
- Fewer grab samples required solely to “check in” on WFI particulate levels
- Less analyst time spent on manual microscopic particle counts
- More consistent data from automated dynamic imaging particle analyzer systems
Extending equipment life and optimizing maintenance
- Identify when rouge or biofilm is beginning to develop
- Plan de-rouging and cleaning validation in WFI lines based on real evidence instead of fixed calendar intervals
- Track improvements or deterioration over time and link them to operating conditions
Summarizing the value: benefits of dynamic imaging over light obscuration for WFI
- Real images, not just counts
- Inline, real-time insight instead of periodic snapshots
- Classification of bubbles, droplets, solids, rouge, and biofilm-related particles
- Integration with plant data systems for richer diagnostics and reporting
- Reduced manual workload and faster investigations
Partnering with Clipper Controls and JM Canty for WFI Quality Control
Local expertise plus specialized technology
- Local application engineering and system integration experience
- Knowledge of sterile injectable manufacturing process monitoring needs
- Familiarity with biopharma purified water and WFI systems from generation through distribution

From site assessment to commissioning and training
- WFI and purified water system review
- Identification of high-risk points and monitoring priorities
- Selection of inline, at-line, portable, and lab analyzers
- Integration planning using CANTY Vector Control Module VCM connectivity
- Commissioning support and operator training
Next steps: evaluate your particles-in-WFI risk
- Are we only testing WFI in the lab, or do we have inline particle detection in sterile water where it matters most?
- Do we understand what our particles are (rouge, biofilm, bubbles, droplets), or just that they exceed a limit?
- Could we reduce investigation time and batch risk with better real-time visibility?
Dynamic imaging offers a clear path forward—from sporadic snapshots to continuous understanding of particles in WFI.
👉 Ready to quantify the ROI of moving beyond light obscuration for WFI?
Message Clipper Controls or call us at (844) 880-2469 to review your current particulate testing strategy and explore the value of dynamic imaging.