Instrumentation Displays
At Clipper Controls, we offer a comprehensive selection of instrumentation display solutions built to enhance visibility, improve operational awareness, and support critical decision-making in industrial, utility, and process environments. From intuitive human-machine interfaces and durable panel meters to precision loop displays and LED signal indicators, our products deliver clear, real-time data for reliable monitoring and control. Backed by trusted manufacturers and expert application support, our display technologies are designed to integrate seamlessly into your system and withstand the demands of harsh operating conditions.
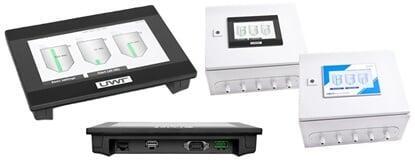
Visualization Systems
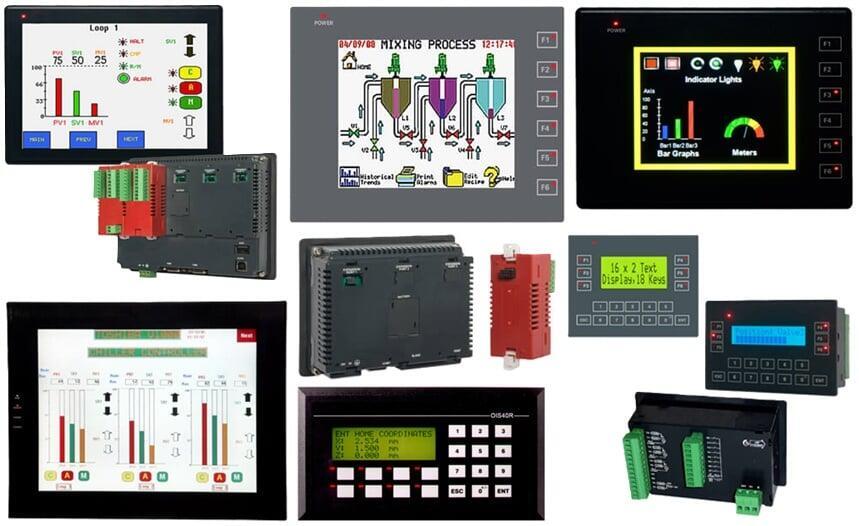
Our visualization systems provide a compact yet powerful interface for monitoring process values, alarms, and diagnostics. Designed for clarity and usability, these displays integrate with sensors and control systems to present real-time data in an intuitive format. With configurable inputs, flexible display modes, and rugged construction, they are well-suited for installations where space is limited but visibility and reliability are essential.
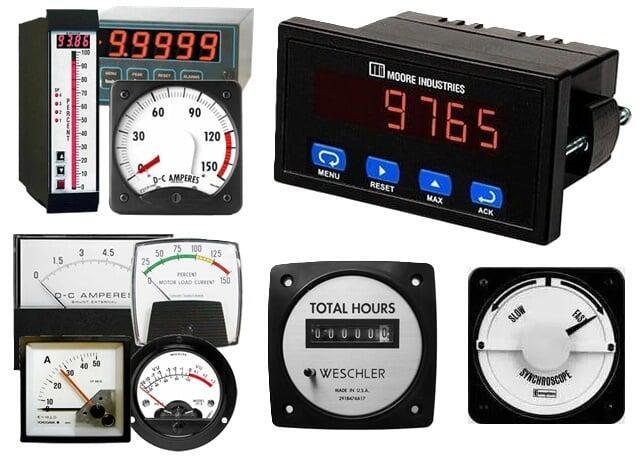
Panel Meters
Our panel meters offer accurate, easy-to-read displays for a variety of process variables such as temperature, pressure, flow, and level. Built for precision and durability, these meters often include signal conditioning and alarm capabilities while fitting standard panel cutouts for straightforward integration. Ideal for both control panels and field enclosures, panel meters deliver reliable, real-time readings that support effective monitoring and troubleshooting.
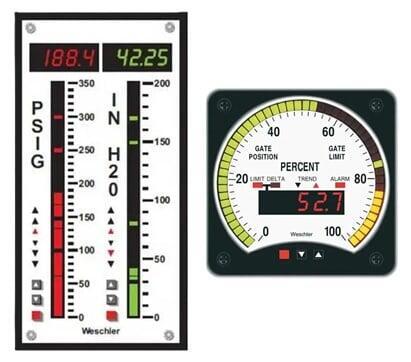
Bar Graph Meters
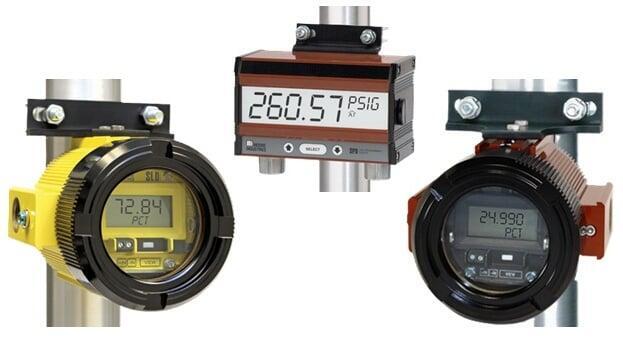
Loop Displays
Human Machine Interface - HMI
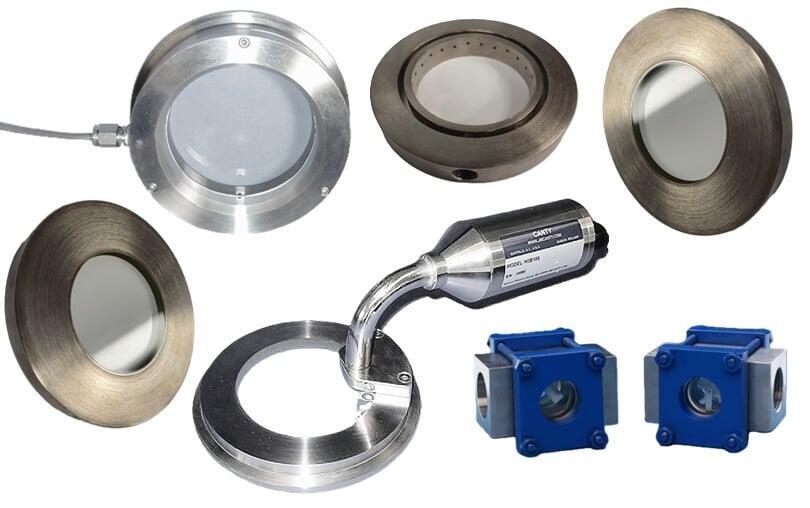
Sight Glasses
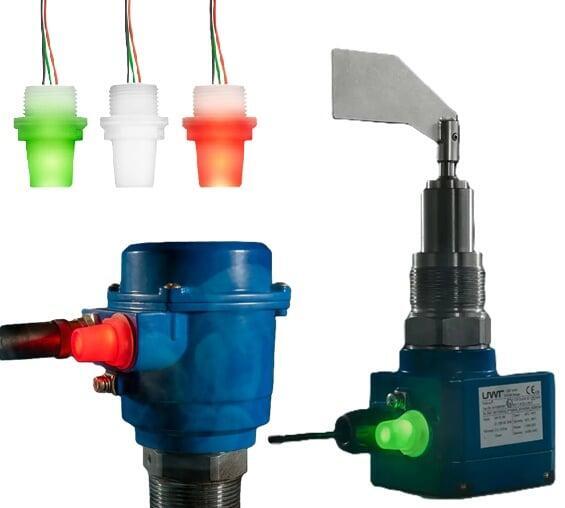
Hazardous Area Signal Lamps
Instrumentation Display Applications
Instrumentation Displays in Semiconductor & Electronics Manufacturing
Semiconductor and electronics manufacturing requires ultra-precise control over complex, multi-stage processes in highly regulated environments. Instrumentation displays play a critical role in providing real-time process visibility, supporting traceability, and maintaining operational stability. Below are key application areas within the industry and the corresponding roles of instrumentation displays:
Cleanroom Environmental Monitoring
Application: Semiconductor fabrication must occur in cleanroom environments where airborne particles, temperature, and humidity are tightly controlled.
Instrumentation Used:
Loop-powered displays mounted in cleanroom walls or tool surfaces show real-time temperature, relative humidity, and pressure differential readings.
Panel meters and bar graph meters provide visual confirmation of environmental parameters for audit and quality control.
Process Equipment Monitoring
Application: Manufacturing steps such as photolithography, chemical vapor deposition (CVD), etching, and doping require stable conditions and precise timing.
Instrumentation Used:
Panel meters display temperature, vacuum levels, and gas flow rates on process tools.
HMIs allow operators to monitor and control step sequences and alarm thresholds across multiple tool subsystems.
Bar graph meters are used for quick assessment of analog trends in critical parameters like pressure or current.
Chemical Distribution & Delivery Systems
Application: Hazardous chemicals used in wafer processing must be delivered safely and consistently to tools.
Instrumentation Used:
Remote visualization displays integrated into control panels show tank levels, flow rates, and pressure in chemical lines.
Loop displays positioned near chemical cabinets provide at-a-glance confirmation of process status during maintenance or refill operations.
Power and Equipment Status Indication
Application: High-precision equipment used in fabrication and assembly lines requires constant status indication to prevent unexpected downtime.
Instrumentation Used:
Signal lamps indicate system status—such as power on, process running, fault, or maintenance required—on equipment enclosures.
Status displays integrated into HMIs provide summary overviews of tool health and process progression.
Data Collection and Compliance
Application: Semiconductor operations must document and archive process data for yield tracking, traceability, and regulatory compliance.
Instrumentation Used:
HMIs and digital visualization displays interface with data loggers and SCADA systems to capture time-stamped process values.
Displays with alarm logging and event tracking ensure that deviations are documented and traceable for corrective action.
Instrumentation Displays in Biotechnology & Pharmaceuticals
Instrumentation displays are essential for maintaining the integrity, consistency, and compliance of processes in the biotechnology and pharmaceutical industries. These sectors demand precise environmental control, validated equipment performance, and traceable process monitoring to meet stringent regulatory standards such as GMP and FDA 21 CFR Part 11. Below are key application areas and the specific use of instrumentation displays:
Cleanroom and Controlled Environment Monitoring
Application: Manufacturing and research in these industries must occur in classified cleanrooms with strict air quality, pressure, and humidity specifications.
Instrumentation Used:
Loop-powered displays provide real-time, local readouts of differential pressure between rooms, temperature, and humidity levels.
Panel meters mounted on walls or equipment enclosures give continuous visibility of environmental compliance conditions.
Bioreactor and Fermentation Process Control
Application: Bioprocesses such as fermentation and cell culture require tight control of variables like pH, temperature, dissolved oxygen, and agitation.
Instrumentation Used:
Visualization displays and panel meters are used to monitor and adjust real-time process values such as pH, DO, and temperature within bioreactors.
HMIs integrate feedback from sensors and allow operators to set process parameters, initiate batch sequences, and observe system trends.
Filtration and Purification Systems
Application: Downstream processing steps—such as chromatography and filtration—require stable pressure and flow conditions to ensure product yield and purity.
Instrumentation Used:
Bar graph meters and digital displays provide visual trends of inlet and outlet pressures, allowing quick detection of filter fouling or blockage.
HMIs allow centralized monitoring and control of pump speeds, valve positions, and alarm conditions during purification runs.
Batch Process Monitoring and Data Logging
Application: Pharmaceutical manufacturing often involves complex batch processes that must be repeatable, validated, and fully documented.
Instrumentation Used:
HMIs capture and display batch parameters in real time and facilitate electronic batch recordkeeping.
Visualization displays serve as local indicators for process steps, ensuring visibility even during manual checks or inspections.
Utilities and Critical Support Systems
Application: Water for injection (WFI), clean steam, and HVAC systems must be continuously monitored to maintain validated process conditions.
Instrumentation Used:
Panel meters and loop displays are installed in utility skids and piping loops to show temperature, conductivity, or pressure values.
Signal lamps indicate readiness, alarms, or sterilization status for utility systems, enabling safe operation and timely response.
Sterile and Sanitary Visual Inspection
Application: Operators must be able to visually inspect processes and fluids inside vessels or transfer lines without compromising sterility.
Instrumentation Used:
Sight glasses with integrated lighting provide safe, sealed viewing windows into process systems, supporting manual and automated inspection routines.
Sanitary-rated instrumentation displays show local process conditions without disrupting aseptic environments.
Instrumentation Displays in Food & Beverage Processing
Temperature and Pasteurization Control
Application: Processes such as pasteurization, cooking, chilling, and sterilization require precise thermal control to ensure food safety and product quality.
Instrumentation Used:
Panel meters and digital displays monitor temperature at critical control points, helping ensure compliance with HACCP and FDA standards.
Loop displays mounted near process equipment provide local readouts of sensor input, enabling immediate verification and adjustments.
Flow and Pressure Monitoring in Process Lines
Application: Accurate measurement of flow and pressure during ingredient transfer, mixing, and CIP (clean-in-place) cycles is essential for both efficiency and sanitation.
Instrumentation Used:
Bar graph meters visually indicate flow rates and pressure fluctuations, helping operators detect deviations or blockages.
Panel displays integrated into control panels show real-time values for pumps and valves to support system performance monitoring.
Batch Mixing and Ingredient Control
Application: Precise dosing, blending, and recipe control are critical in batch operations to maintain consistency and product quality.
Instrumentation Used:
HMIs allow operators to view and adjust batch parameters, sequence logic, and alarm conditions for automated mixing systems.
Visualization displays provide confirmation of ingredient flow rates, tank levels, and process timers at the point of operation.
Packaging Line Monitoring
Application: Monitoring conveyor speeds, filling levels, seal temperatures, and machine status helps ensure uptime and avoid product loss.
Instrumentation Used:
Signal lamps provide quick visual indication of machine status—run, fault, jam, or stop—along the production line.
Digital displays offer real-time readouts for temperature or pressure control in filling and sealing machines.
Sanitary and Hygienic Process Visibility
Application: Direct visual inspection is often needed to verify fluid clarity, color, or presence of bubbles or particulates, especially in dairy, beverages, and sauces.
Instrumentation Used:
Sanitary sight glasses with integrated lighting allow safe, sealed observation of product lines without contamination risk.
LED-enhanced sight ports offer illumination in otherwise opaque or enclosed systems for manual inspection or camera-based monitoring.
Facility Utilities and CIP Systems
Application: Cleaning, sanitation, and utility systems (such as hot water or steam) must be monitored to meet safety and cleanliness requirements.
Instrumentation Used:
Loop-powered displays and panel meters indicate temperature, conductivity, and pressure during CIP cycles.
HMIs consolidate utility status, providing control over cleaning phases, cycle documentation, and system readiness.
Instrumentation Displays in Water & Wastewater Management
Flow and Level Monitoring in Collection and Distribution Systems
Application: Accurate tracking of water levels and flow rates is essential in pump stations, lift stations, reservoirs, and distribution pipelines.
Instrumentation Used:
Loop displays mounted at remote sites show local flow and level data, providing at-a-glance confirmation for field operators.
Panel meters installed in control rooms offer precise numerical indication of flow and level across the system for centralized monitoring.
Treatment Process Monitoring
Application: Water and wastewater treatment processes such as coagulation, filtration, disinfection, aeration, and sludge handling require stable and controlled operating conditions.
Instrumentation Used:
Bar graph meters visually represent variables like turbidity, pH, dissolved oxygen, and residual chlorine for rapid assessment of process trends.
HMIs provide operators with an overview of treatment stages, alarms, and system performance, allowing for quick diagnostics and control adjustments.
Pump and Equipment Status Indication
Application: Maintaining reliable operation of pumps, blowers, and mixers is essential for uninterrupted treatment and system integrity.
Instrumentation Used:
Signal lamps indicate equipment status, such as run, stop, fault, or maintenance mode, on both local panels and control stations.
Digital status displays provide clear readouts of motor load, run time, and pressure, helping detect early signs of mechanical issues.
Disinfection and Chemical Dosing Control
Application: Chlorination, UV disinfection, and chemical dosing systems must be precisely monitored to ensure treatment efficacy and regulatory compliance.
Instrumentation Used:
Visualization displays present real-time readings of dose rates, flow ratios, and system status at chemical skids or dosing panels.
Panel meters show key values such as chlorine concentration, ORP, or pump output, enabling quick verification and manual control.
Compliance Monitoring and Reporting
Application: Water utilities must continuously monitor critical parameters and maintain accurate records for regulatory reporting and audits.
Instrumentation Used:
HMIs and loop displays interface with SCADA and data logging systems to capture and display values such as effluent flow, ammonia, nitrate, and total solids.
Digital displays with alarm and trend functions support compliance by ensuring prompt response to threshold excursions.
Remote Site Monitoring
Application: Distributed assets like wells, tanks, and lift stations often operate unattended and require reliable local indication for maintenance crews.
Instrumentation Used:
Rugged loop-powered displays provide essential process information without external power.
Compact visualization displays enable quick, local verification of conditions before service or inspection tasks.
Instrumentation Displays in Energy Production
Turbine and Generator Monitoring
Application: Monitoring the operational parameters of turbines and generators is vital for ensuring efficiency, preventing failure, and maximizing uptime.
Instrumentation Used:
Panel meters display key values such as voltage, current, frequency, and RPM directly on control panels.
Bar graph meters visually track dynamic parameters like vibration, load balance, or shaft speed for early fault detection.
Boiler and Combustion Control
Application: In thermal power plants, maintaining safe and efficient combustion in boilers is critical to energy production and emissions compliance.
Instrumentation Used:
HMIs provide real-time visualization of combustion airflow, fuel flow, steam pressure, and temperature control loops.
Digital displays mounted on equipment show localized readings of flue gas composition, feedwater temperature, and burner status.
Renewable Energy System Oversight
Application: Solar, wind, and geothermal energy systems require constant tracking of environmental inputs and system performance to optimize generation.
Instrumentation Used:
Loop displays and panel meters show real-time solar irradiance, wind speed, inverter output, or geothermal fluid conditions.
Visualization displays provide summary readouts at combiner boxes, inverters, and data acquisition points across distributed generation sites.
Grid Interface and Load Management
Application: Interfacing with the power grid requires precise coordination of voltage, phase, and load balancing to maintain system stability and prevent outages.
Instrumentation Used:
HMIs and graphical displays offer operators centralized control over synchronization, switching, and power factor correction.
Panel meters provide accurate readings of real, reactive, and apparent power across feeder lines and substations.
Fuel and Cooling System Monitoring
Application: Monitoring fuel delivery systems and cooling water loops is critical to thermal plant efficiency and safety.
Instrumentation Used:
Digital displays monitor pressure, flow, and temperature of cooling water, fuel gas, or oil to prevent overheating or inefficiency.
Signal lamps provide quick visual alerts for low fuel levels, pump failures, or abnormal cooling conditions.
Environmental and Emissions Compliance
Application: Power plants must continuously monitor emissions, temperature, and particulate matter to meet environmental regulations.
Instrumentation Used:
HMIs collect and display data from CEMS (Continuous Emissions Monitoring Systems), providing immediate feedback on NOx, SO₂, CO₂, and particulate output.
Bar graph and numeric displays show stack temperatures, draft pressure, and flow rates in exhaust systems to support emissions control.
Instrumentation Displays in Mining & Mineral Processing
Mining and mineral processing operations rely on rugged, real-time monitoring systems to maintain safe, efficient, and continuous production in harsh and often remote environments. Instrumentation displays provide critical visual feedback for key process variables, allowing operators to monitor equipment performance, manage resource flows, and respond rapidly to abnormal conditions. Below are typical application areas and the roles instrumentation displays play across the mining value chain:
Crushing, Grinding, and Screening Equipment Monitoring
Application: Early-stage material size reduction equipment must operate within tight parameters to avoid mechanical damage and ensure downstream efficiency.
Instrumentation Used:
Panel meters display motor load, vibration levels, and feed rates for crushers and mills.
Signal lamps indicate equipment status—such as run, fault, or maintenance needed—at key operator access points.
Slurry and Dewatering System Control
Application: Slurry transport, thickening, and dewatering processes depend on stable flow, pressure, and density control to optimize material handling.
Instrumentation Used:
Loop-powered displays provide local readouts of pump pressure, slurry density, or flow rate near transfer stations or thickeners.
Bar graph meters visualize trends in tank levels or filtration performance, allowing quick response to process changes.
Reagent and Chemical Dosing
Application: Precise control of pH modifiers, flocculants, and collectors is critical for effective flotation and separation processes.
Instrumentation Used:
Digital displays show flow rates and concentration levels of chemical feeds into process streams.
Visualization displays on skid-mounted systems allow monitoring of tank levels, pump status, and alarm conditions.
Leaching, Flotation, and Separation Monitoring
Application: These stages require careful monitoring of variables such as pH, oxidation-reduction potential (ORP), and air or reagent flow.
Instrumentation Used:
HMIs display real-time process data for each cell or stage, enabling fine adjustments for yield optimization.
Panel meters and local indicators provide quick visual feedback during manual inspection or maintenance.
Conveyor and Material Transfer Systems
Application: Moving large volumes of ore and aggregate safely and efficiently demands continuous monitoring of mechanical systems.
Instrumentation Used:
Signal lamps and panel meters monitor motor status, belt speed, and torque to detect overloads or misalignment.
Loop displays provide feedback on material weight or volume using load cells or volumetric sensors.
Dust Suppression and Environmental Monitoring
Application: Air quality and dust control systems must be monitored to protect worker safety and comply with environmental regulations.
Instrumentation Used:
Digital displays track airflow, spray pressure, and particulate levels in dust suppression systems.
HMIs consolidate environmental data across sites and provide trend history and alarm notifications for compliance tracking.
Terms & Definitions
- Alarm Indicator
- A visual or audible signal that alerts operators to abnormal process conditions, often triggered by high or low thresholds in system parameters.
- Bar Graph Meter
- A display that uses a dynamic bar to represent process values, making it easy to visualize operating ranges, setpoints, or deviations at a glance.
- Digital Display
- A screen that presents process information numerically, commonly found in panel meters, loop displays, and HMIs for precise value readouts.
- Display Scaling
- The configuration that translates raw input signals (like 4–20 mA) into meaningful engineering units such as PSI, °C, or GPM on a display.
- Field-Mount Display
- A ruggedized display unit installed near the measurement point to provide local readout of process variables, often loop-powered for remote locations.
- Fuse-Sealed Sight Glass
- A sight glass with borosilicate glass fused directly to a metal frame, eliminating gaskets for improved durability under pressure and temperature extremes.
- Graphical User Interface (GUI)
- A visual layer within an HMI that allows operators to interact with process data through icons, menus, and graphical representations.
- HMI (Human Machine Interface)
- An operator-facing system used to control, monitor, and adjust automated processes via touchscreen displays and programmable visual elements.
- Indicator Light
- A simple visual signal—often using LEDs—to show the status of equipment or processes, including power, run/stop, fault, or alarm states.
- LED Signal Lamp
- A high-visibility, energy-efficient light used to indicate system status or alarms; durable enough for harsh industrial environments.
- Loop Display
- A compact digital display powered by the 4–20 mA loop it monitors, eliminating the need for an external power source and ideal for field use.
- Operator Interface
- A hardware or software platform, such as an HMI or panel meter, that enables users to view, manage, and interact with automation systems.
- Panel Meter
- An electronic instrument mounted in a panel to provide real-time readout of system variables like flow, pressure, temperature, or voltage.
- Process Visualization
- The use of digital or graphical displays to represent live process data, enhancing operator insight and control system transparency.
- Sanitary Sight Glass
- A sight glass designed for hygienic environments, often featuring LED illumination and smooth, cleanable surfaces for food or pharmaceutical use.
- Setpoint
- A target value for a process variable that a control system strives to maintain; often displayed and adjusted via meters or HMIs.
- Signal Conditioning
- The modification of input signals—such as amplification, filtering, or isolation—to prepare them for accurate measurement or display.
- Sight Glass
- A transparent viewing window that allows operators to observe internal process conditions without opening or interrupting the system.
- Status Display
- A type of readout that provides binary or text-based indicators for system states like on/off, open/closed, or alarm/normal.
- Visualization Display
- A small digital screen that presents real-time system data, alarms, and diagnostics in a clear, configurable format for quick operator feedback.

Products We Offer
Applications
Resources
Brands We Recommend